People to Watch 2021
Welcome to our People to Watch 2021 program!
Each year, we take a good look at what is ahead to determine a select group of leaders in Big Data that are hitting their stride and stepping ahead of the rest. In our 6th year, we are offering our readers that special glimpse into some of the best and brightest minds emerging in the industry. Their hard work, dedication, and contributions reach far beyond analytics, and are shaping the direction that technology is taking us as a people. This is the cutting edge, and these are the people who are pushing the envelope.
We present the Datanami People to Watch 2021:

How did you become interested in data visualization? What was your first inkling that you could make a career of this?
If you can believe it, I published my first JavaScript library for data visualization back in 1998 when I was a college intern for Netscape. At the time there was no Canvas or SVG, so creating graphics in the browser required elaborate hacks with tables and tiny GIFs. I’ve long been fascinated by computer graphics — I remember being blown away by the early CG in Jurassic Park and Toy Story, and graphics was my favorite subject as an undergraduate.
My first serious foray into visualization was at Google, where I worked with Melody (my future Observable cofounder) on a team responsible for evaluating search experiments. Engineers would invent tweaks to ranking; our job was to provide a quantitative, comprehensive view of how these tweaks would affect the overall user experience. Often changes targeted a specific class of query (say, natural language questions) but might have unintended effects on other queries. Our metrics would score experiments from 1 to 5, the idea being that a high score would clear a change to land. Yet when an experiment scored poorly, engineers would often question the metrics’ accuracy. Visualization became a way to surface more evaluation data — as opposed to black box metrics — so we could make better informed, more accurate decisions.
Luminaries would often visit Google, so I also had the privilege of seeing Edward Tufte and Tamara Munzner (and others) speak. This opened my eyes to information visualization as a formal practice, and eventually led to me going back to school, to Stanford. At that point I suppose it was my career.
You founded Observable with Melody Meckfessel in 2016 after working in the graphics department at The New York Times. How did your experience with journalism at the NYT inform your mission at Observable?
My time at The New York Times reaffirmed my belief that visualization is a powerful medium for communicating insights to any audience — it’s not just for scientists, statisticians, quants, etc. Perhaps my favorite graphic from that era was “512 Paths to the White House” (in collaboration with Shan Carter, who now leads design at Observable); I love how this graphic provides a “macro” view of all possible outcomes of the 2012 presidential election. Talking heads love to pore over obscure what-if scenarios, regardless of their improbability; our graphic was a counterpoint that let you see everything at once and get a better sense of what might happen.
Shan Carter and I also built a system, Preview, that allowed everyone in the graphics department to see in real-time what everyone else was making; like a GitHub for graphics, you could see not only the live in-development graphic, but all previous versions and branches. Shan and I (and later, Jennifer Daniel) were based in San Francisco, and Preview dramatically improved our ability to collaborate with the rest of the department on Eighth Avenue. This notion of bringing transparency, openness, and collaboration to data analysis and visualization is central to Observable’s vision.
Working on published graphics also convinced me that data visualization was still too hard, too expensive, and despite its potential for discovery and communication, underutilized. So Melody and I founded Observable with the goal of making visualization more approachable and more practicable — without giving up its essential creativity and expressiveness. We call this “lowering the floor without lowering the ceiling.”
What is the most non-intuitive thing about data visualization that you can tell our readers? What continually surprises you about the nature of your work?
There’s a tendency to assume that visualization is a superpower — a magical lens that somehow reveals every nuance of data by virtue of making it visible. In reality a visualization must be designed with a specific question in mind (or perhaps a small set of related questions), similar to a statistical test, and it answers only that question. Furthermore, a visualization is not an agnostic or impartial view of data, as its design strongly influences interpretation. And data itself has bias! This all suggests that care must be taken when designing visualizations — we can’t simply “splat” data to the screen — and when reading them. The effect of design may be revealed by redesigning, a form of critique that is facilitated by Observable’s fork button. (Though see Viégas & Wattenberg’s “Design and Redesign” for risks and guidelines on doing this fairly and constructively.)
Another underappreciated quality of visualization, I think, is the difference between exploratory and explanatory visualization. Exploratory graphics you make for yourself to find new insights in data. Explanatory graphics in contrast communicate some known insight to an audience. The goal of exploratory visualization is primarily speed: how quickly can you construct a view that answers your question? You can afford to cut corners when you’re the intended reader, as you already have context. Whereas you must provide explicit context for an explanatory graphic. A good explanatory graphic should know what it’s trying to say, and say it. Explanatory graphics can include exploratory elements, for example allowing the reader to “see themselves” in the data, but ideally these shouldn’t detract from the primary message. Don’t make the reader work for insight; that’s your job as the editor.
Outside of the professional sphere, what can you share about yourself that your colleagues might be surprised to learn – any unique hobbies or stories?
Back in the pre-pandemic days (“the before time”), I would commute daily from Marin to Observable’s downtown San Francisco office by bike, which was about 17 miles each way (with a nice climb at the end). I absolutely loved it. It’s so much less stressful than being stuck in a car in traffic. And getting to see the Golden Gate Bridge in all sorts of weather and light was awe-inspiring. I’d often stop to admire the view, say of the towers poking out of the fog, or a massive container ship sliding off into the sunset. If you can, ditch your car in favor of walking or biking. Sadly these days I rarely leave the house… Hopefully I’ll be back in the saddle again soon.

The shortage of data scientists is often cited as a barrier to success in data science and machine learning, but you see data engineering as the real problem. Can you elaborate on your thoughts on the matter?
Data science has exploded across departments and job functions in almost every industry, which has definitely created a shortage of data scientists. However, the data scientists that companies do have are often held back by their increasing need for streamlined and scalable access to data, a function typically handled by data engineers. Data engineering is responsible for data pipelines that collect, unify, enrich, and refine data into usable building blocks for analytics.
Unfortunately, there simply aren’t enough data engineers to meet demand. For the companies that do have data engineering talent, these professionals have to devote the majority of their time to maintaining brittle systems and servicing the needs of other teams. When they are finally free to build new data pipelines, prototyping and productionizing the most basic projects takes months, if not longer.
The problem is an inability to scale – not of bytes or records, but of builders and their velocity. A company’s ability to operationally scale data initiatives requires a faster, more reliable, and automated way for businesses to democratize data access across the enterprise, allowing data teams to drive innovation and deliver insights faster. Only then will businesses be able to turn those investments into business success.
Apache Spark is at the heart of your offering at Ascend.io. Considering all the misplaced hoopla over Hadoop, do you feel confident the same will not occur with Spark?
Apache Spark is quite a remarkable technology, and while it is certainly showing its ability to stand the test of time, we do believe that there is no one size fits all when it comes to data products and the architectures that power them. Companies are currently grappling with their approach to the data lake versus data warehouse versus data lakehouse, just as they have with batch versus streaming versus micro-batch.
Ultimately, what users want is the benefits of these various approaches, and the flexibility to move between them as their business needs require, without the need to re-architect their entire data strategy. Ascend.io has invested heavily to give our customers this flexibility, whether it is across clouds or across data silos. Our flex-code data connectors give customers the ability to easily connect into and even transition data systems with tremendous ease. Keep an eye out for us to continue this trend in 2021, with the ability to soon leverage far more underlying platforms for processing data than ever before.
What is a common mistake that people make regarding their data, and what sorts of new powers can be unlocked if they’re addressed?
A common mistake for many companies today is how their data teams are structured. When it comes to staffing, management is responsible for setting their data teams up for success; however, far too often, management may not have the insight or expertise to hire the right team with the right range of skills, which can lead to many challenges down the road. Commonly, management may have only prioritized hiring data scientists, meaning there is no data engineering or operations talent to support the data science initiatives. This unbalanced ratio of data engineers to data consumers can cripple the productivity of data teams, leading to significant delays in analytics timelines. Another scenario is that management may hire the wrong people, due to not fully grasping the tasks at hand. Data engineering is still an emerging field, which can often lead to missteps in the hiring process. Management may hire individuals into the role of “data engineer,” but far too often, these professionals may just be software engineers or database administrators. To avoid this, management must closely evaluate what personas they have to adequately determine what skills they need on their data team and be open to troubleshooting and course-correcting along the way.
Another common pitfall for data teams is the threat of what I call “accidental ransomware.” Many data engineers – especially early in their career – are solely interested in building their own data systems and platforms from the ground up, relying on open-source technologies to cobble together a proprietary system that will get the job done. The problem with this scenario is that if the data engineer who built it decides to leave the company, it’s extremely unlikely that anyone else in the business will be able to maintain – or frankly, even use – this system. It can reach the point where managers of data teams feel they are being held hostage by these platforms, hence the term accidental ransomware. Thankfully, many of the data professionals who started their careers building these systems over a decade ago – at the peak of open source – have now experienced first-hand just how daunting, time-intensive, and costly the building process can be. This has led many data teams to instead opt for buying solutions to maximize value for their business and avoid any potential accidental ransomware.
Outside of the professional sphere, what can you share about yourself that your colleagues might be surprised to learn – any unique hobbies or stories?
We have a pretty tightly knit team, so I’m not sure this would come as much of a surprise to my colleagues, but I absolutely love running. My parents were both runners, and even as little kids they would take my twin brother and I with them to the local track, and let us play in the long jump pit (aka a sandbox) while they ran. We both competed in cross country and track and field all the way into college and to this day run with each other as often as we can.
One of the absolute best things about running, however, is that it is an incredible way to see a new town, city, or even countryside. I used to travel a lot for work and would be in a different country almost every month with very little free time to see the sites. Tossing on my running shoes for a 6:00 a.m. run around the Imperial Palace in Tokyo, the Opera House in Sydney, or Hyde Park in London was a fantastic way of taking in the sights before a long day of meetings. I even would take a unique route back from Tokyo which had back-to-back red-eyes with a 10-hour layover in Honolulu. I’d use hotel points to get a cheap room in Waikiki for my bags, lace up my running shoes, and run to the top of Diamond Head and back before getting a huge post-run meal, showering, and heading back to the airport.
Every once in a while, however, business travel takes you somewhere quite unique and this led to my absolute favorite run of all time. I had just wrapped up a conference in Monaco – which is an experience in and of itself – and a teammate and I had a day before we flew out. We decided to rent a tiny car and picked a random town on the map way up in the hills called Sospel. Once we arrived, we set a goal: run to Italy. And, to make it more fun still: no roads. And over the course of a long run, we found our way to Italy on tiny trails, train tracks, tunnels, and even bridges (for the trains). It was an unforgettable experience.
To this day, I take my running shoes with me everywhere I travel as there is always some road, trail, or train tracks waiting to be explored.
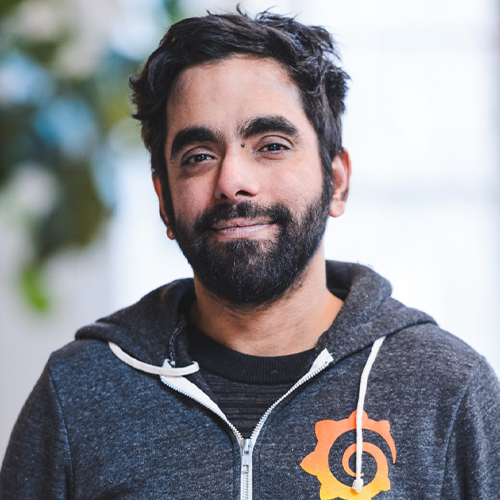
Grafana seems to have come out of nowhere in recent years — or at least to have emerged from Elastic’s shadow. What do you attribute that higher market visibility to?
I don’t think about Elastic as casting a shadow, but quite the opposite: They’ve cast a lot of light into this space and open source. Tens of thousands of companies are using Grafana as their operational front-end and many rely on us for their back-end observability and monitoring needs too. I think with so many different vendors, Grafana is this key piece that brings together that chaos. Organizations are clearly saying that they own their own observability strategy vs. locking into a single platform for everything. Grafana gives them the freedom to “compose” their visualizations; for example, they may be looking at logs from Elasticsearch, Splunk and Loki, along with service tickets from ServiceNow in a single dashboard — which can be IT, operations or business.
People are building dashboards to monitor everything these days, from servers to beehives. What is the underlying factor driving this activity?
The journey was an amazing surprise for us. What started out as decoupling the dashboard from the underlying database for time series insights ended up exploding through community adoption. People had all these ideas of what they could now do with the freedom to use the data sources of their choice. It might sound cheesy, but IoT means that everything, from your Kubernetes clusters to someone’s Tesla and their toaster oven, is emitting information and events, and if you watch posts and comments on Twitter or Reddit about Grafana, you’ll find new examples nearly every day.
Grafana is a product of the open source community, but the nature of open source seems to be changing. In some ways, it’s becoming less open. What is Grafana’s plan to navigate these changes?
Grafana has an interesting story. Originally it was a fork of a popular open source tool called Kibana, which was eventually brought into Elastic and is the visualization piece of the ELK stack. Kibana was built to only show data from Elasticsearch, and it wasn’t at all optimized for time series data. Today, Grafana and Kibana share almost no code, and the “community” was really about two people early on: Rashid Khan, who created Kibana and wrote most of the code, and Torkel Ödegaard, who forked Kibana to create Grafana. Flash forward to today, and there is a vibrant community that pushes us consistently to make a better product and right now, we are heavily focused on delivering on very aggressive roadmaps… and continue to be quite open about them.
Outside of the professional sphere, what can you share about yourself that your colleagues might be surprised to learn – any unique hobbies or stories?
Aviation has been a big interest of mine for a really long time, and I actually got my private pilot’s license when I was in college. I even moonlighted as a cargo pilot in the early days of my first startup! Sadly, I’ve been grounded.

Timnit Gebru 1983 is a computer scientist who works on algorithmic bias and data mining. She is an advocate for diversity in technology and co-founder of Black in AI, a community of black researchers working in artificial intelligence. Gebru was born and raised in Addis Ababa, Ethiopia, but was forced to flee at age 15. She completed high school in Massachusetts and was accepted to Stanford University where she obtained both her bachelor’s and master’s degrees in electrical engineering. Gebru worked at Apple Inc., developing signal processing algorithms for the first iPad. Gebru earned her doctorate under the supervision of Fei-Fei Li at Stanford University in 2017. Gebru went on to work at Google, where she was co-leading a team on the ethics of artificial intelligence. She studied the implications of artificial intelligence, looking to improve the ability of technology to do social good. Her departure from Google in December 2020 has raised many eyebrows and caused quite the controversy. We look forward to seeing what Timnit does next.

You started the Stanford DAWN project with Matei Zaharia. What’s your assessment of that project’s success, and will there be a follow-up?
Several of the core research directions in DAWN have led to big improvements in making ML more usable, from new interfaces to new hardware. A number of these directions now have lives of their own outside DAWN, both in deployments at scale at places like Google, Microsoft, and Intel, and in products like Sisu, Snorkel.ai, Inductiv, and SambaNova.
As a five-year research project nearing its completion, I’d declare DAWN a success, and I expect we’ll see at least one new five-year follow-on project in the future.
Sisu is based on technology from the Stanford DAWN project. What do you see as the biggest challenges in getting promising research from academia into the hands of industry?
One of our tenets in DAWN is working closely with industry partners from day one, which means that we have exposure to some of the hardest and most challenging problems facing the most advanced data companies. This lets us see around corners and “live in the future.” By the time the research has progressed after a few years, the rest of the world has often caught up.
I think a lot of research fails to bridge the gap between academia and industry because it’s so hard to invest the time and effort to understand these problems on the cutting edge, and to invest the long-term, multi-year focus required to develop complete systems rather than incremental algorithms.
This focus on the future is something I learned from my advisors at Berkeley and is something I’m proud to carry on with my students and my colleagues at Sisu.
It feels as though we’re in the midst of a breakthrough in analytics with the surge of cloud data warehouses. Are we really exploring new ground? What do we need to do to get to the next level?
We’re witnessing an aggregation and consolidation of data that’s never been seen, to the point that organizations – for the first time ever – have access to incredibly fine-grained detail about their operations and performance. In addition, with the cloud, it’s surprisingly cheap to process all this data.
But the resulting bottleneck isn’t about data or computers – it’s about people. Even though the typical business user has access to more data and compute power than we’d have dreamed of even 10 years ago, today’s data tools still require the user to manually explore, investigate, and make decisions using this data. This doesn’t scale, and most of this data is never used.
I believe the next level of analytics will come from systems and tools that put people center stage – not replacing their intuition and ingenuity – but amplifying their uniquely human traits with superhuman levels of automation and speed. We call this human-centric approach “augmented intelligence,” and, if successful, it’ll enable analytics at the speed of thought.
Outside of the professional sphere, what can you share about yourself that your colleagues might be surprised to learn – any unique hobbies or stories?
As a kid growing up in Nebraska, my teachers used to complain to my parents that I asked too many questions during class. “How big is the universe?” “How did we come up with the Dewey Decimal system?” “Why are lizards cold-blooded?”
Once we got access to digital encyclopedias and then the early Internet at school and home, this (sometimes bothersome!) tendency to ask questions really fueled my love of computers. Steve Jobs called the computer a “bicycle for the mind” and once I realized how far this bicycle could take me in answering my questions, I was hooked.

As executive vice president of the Microsoft Cloud + AI Group, Scott Guthrie is responsible for Microsoft’s cloud computing fabric and Artificial Intelligence platform. This spans products and services such as Microsoft Azure, the global cloud computing platform, Microsoft Business Applications, including the automated business process capabilities of Dynamics 365 and low-code/no-code tools in the Power Platform, and Mixed Reality, including HoloLens. It also includes a rich set of developer tools with Visual Studio, Visual Studio Code and GitHub, core commerce capabilities and infrastructure, and end-to-end security and compliance solutions across the Microsoft Cloud.
Most recently, Guthrie was corporate vice president of the Microsoft Azure team. Since joining the company in 1997, he has made critical contributions to many of Microsoft’s essential cloud, server and development technologies, and was one of the founders of the .NET project.
Guthrie graduated with a bachelor’s degree in computer science from Duke University.

Can you provide a quick description of Domo and why it’s different than other BI tools? What makes it unique?
Domo is a modern BI platform that was designed to help organizations of all sizes drive more value from their business data and existing IT investments. Our cloud-native platform’s ability to integrate and transform massive amounts of data from any source, query and visualize it at breakneck speed, and share actionable insights in record time with anyone inside or outside an organization, are a few of the things that make us unique.
How do you see data analytics evolving over the next five years? What can organizations do to get ahead of the game?
In the next five years, analytics will evolve to be even more integral to how businesses are run. Traditional BI has always been about serving the few with insight, whether that be through a report or a dashboard. I see Modern BI as being for everyone and that requires a fundamentally different approach.
To get ahead of the game, organizations need a different approach. All data needs to be unified, governed and democratized across the business. And it needs to be delivered in a way that makes it easy for anyone to understand, engage and take action on it – whether that be through data stories, business apps, or other forms of business-user friendly analytics.
You co-founded Omniture, which was acquired by Adobe. What did you learn from that experience and how did you apply it to Domo?
As co-founder and CEO of Omniture, I learned that data is only valuable if you can do something with it. Back then, I’d see how marketers were using our web analytics to drive more ROI for their business. It was frustrating to me that I didn’t have that same access to the data I wanted about my own business. I founded Domo to solve that problem and give everyone from the CEO to the frontline worker real-time access to the data they need to make better decisions and take action to drive their business forward.
Outside of the professional sphere, what can you share about yourself that your colleagues might be surprised to learn – any unique hobbies or stories?
The name of our company, Domo, was born out of the love I have for Japan. I lived there for two years as a young missionary and can still speak the language. It was the first place we opened a Domo office outside of the U.S. The culture – including the people, the food, the traditional customs contrasted with the country’s modernization, and of course, karaoke – is unlike any other place where I’ve traveled or lived. I absolutely love it and can’t wait to go back when it’s safe to do so.
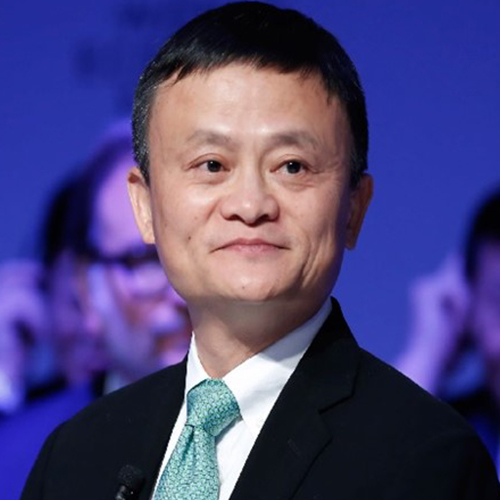
Jack Ma is a Chinese businessman, investor, and philanthropist. Once a poor lad who survived by guiding tourists, Jack went on to rise above his humble condition and achieve success. He started off by improving his communication skills and also learned English. Jack was one of the first few individuals who saw the Internet as a business opportunity even at a time when the rest of the world didn’t believe in his vision. After starting his first venture with a mere $20,000, the entrepreneur went on to earn around $800,000 in just three years. In the late-1990s, he founded the e-commerce based venture ‘Alibaba’ which catapulted him to global fame. The revenue generated by the firm helped him reach the zenith of success and made him the richest man in China. He even co-founded other similar ventures which were also successful to a great extent; one of these was an e-commerce website called ‘Taobao.’ Jack is the recipient of many awards. He has also been featured in world-renowned magazines, such as ‘Forbes’ and ‘Time.’

Fei-Fei Li is the inaugural Sequoia Professor in the Computer Science Department at Stanford University, and Co-Director of Stanford’s Human-Centered AI Institute. She served as the Director of Stanford’s AI Lab from 2013 to 2018. And during her sabbatical from Stanford from January 2017 to September 2018, she was Vice President at Google and served as Chief Scientist of AI/ML at Google Cloud. Li obtained her B.A. degree in physics from Princeton in 1999 with High Honors, and her PhD degree in electrical engineering from California Institute of Technology (Caltech) in 2005. She joined Stanford in 2009 as an assistant professor. Prior to that, she was on faculty at Princeton University (2007-2009) and University of Illinois Urbana-Champaign (2005-2006).
Li’s current research interests include cognitively inspired AI, machine learning, deep learning, computer vision and AI+healthcare especially ambient intelligent systems for healthcare delivery. In the past she has also worked on cognitive and computational neuroscience. Li has published more than 200 scientific articles in top-tier journals and conferences, including Nature, PNAS, Journal of Neuroscience, CVPR, ICCV, NIPS, ECCV, ICRA, IROS, RSS, IJCV, IEEE-PAMI, New England Journal of Medicine, Nature Digital Medicine, etc. Li is the inventor of ImageNet and the ImageNet Challenge, a critical large-scale dataset and benchmarking effort that has contributed to the latest developments in deep learning and AI. In addition to her technical contributions, she is a national leading voice for advocating diversity in STEM and AI. She is co-founder and chairperson of the national non-profit AI4ALL aimed at increasing inclusion and diversity in AI education.

Jeremy Achin is the CEO and co-founder of DataRobot. As a data scientist turned entrepreneur, Achin developed an obsession with automating his job. He turned this passion into product in 2012, and since then, has built DataRobot into the leading enterprise AI platform. DataRobot, under Achin’s leadership, is spearheading the intelligence revolution by empowering public and private sector organizations to become AI driven. Backed by more than $750 million in venture funding from the world’s top investors and with customers ranging from Fortune 500 companies to government agencies, hospitals, and nonprofits, DataRobot is on a mission to help all businesses turn their data into insights through the power of AI.
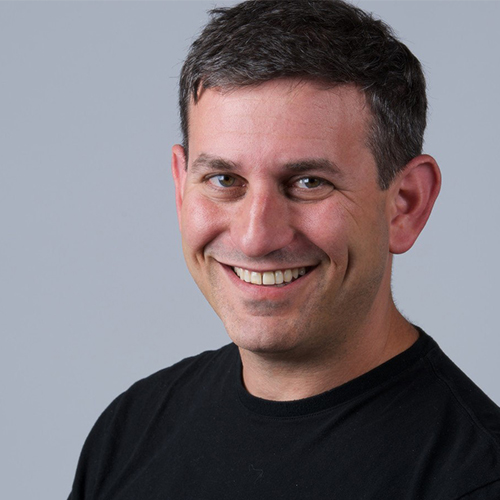
We’ve seen the emergence of interaction data completely swamping the scale of transactional data of the previous generation. What are you looking for in the next wave of data?
Interaction data from software has been a huge wave and it’s still washing over us. But right behind it is the wave of sensor data from the physical world. Think image and video, mobility and of course IoT. Until recently we mostly treated this as media, for archival, replay and possibly search. AI is now helping us extract structured “features” from media, translating physical signals into discrete data records that can be analyzed and tabulated. For better and for worse, we’re on track to literally record the physical world as bits and convert it to records—translating the raw bitstreams of sensing into higher-level, meaningful data for analysis. This is going to stretch our existing technologies, policies, and ethics.
You’ve maintained your career in academia while simultaneously pursuing interest in private industry. Lots of other folks have had less-than-stellar success at that. What’s your secret?
Success comes down to the people you spend time with. Primarily I’m lucky to have been surrounded by amazing mentors and colleagues, and it’s no surprise that many of them have also succeeded on both these fronts. The good fortune of being at Berkeley has been a big part of that.
In terms of suggestions, I’d lead with one of my favorite quotes: “Laziness in doing stupid things can be a great virtue”.
And anybody who does creative work needs to read Herman Melville’s short poem called “Art”. It has the prescription.
How would you characterize the state of data science education at the university level? Are we bringing enough young adults into the programs, and are we teaching them the right things and exposing them to the right ideas to be successful upon graduation?
It’s getting real, and we’ve been aggressive on this front at Berkeley so we’re navigating the edge of the wave. Our Data Science courses are now taken by thousands of students every single semester, and we’re starting to produce thousands of data science majors at Berkeley as well. Of course, it’s early and we’re still learning. One shift that I’m pushing for is more focus on Data Engineering. It’s not enough to teach statistics and machine learning algorithms on toy data in notebooks. We need to expose students to issues of wrangling messy real-world data and orchestrating complex scalable systems. I’m happy to say we’re offering our first undergraduate Data Engineering course at Berkeley this semester, and lessons from my time in industry have been very helpful.
You’re from Berkeley, but your Trifacta co-founder Sean Kandel is a Stanford guy. Do you have an axe at Trifacta, and if so, who is holding it now?
Yeah, well, we don’t need to go there. I mean, Sean definitely enjoys a little smack talk now and then. But I’m a lover, not a fighter. And as the grown-up, it’s my job to set the tone. Which is easy to do when the superiority of my institution is so obvious.
Outside of the professional sphere, what can you share about yourself that your colleagues might be surprised to learn – any unique hobbies or stories?
I play a lot of trumpet. One of my quarantine activities was to play the horn tracks for an upcoming album from James Combs called “Impolitic”. Check it out. On a somewhat less hummable front, I’ve also been participating in a weekly online free improvisation group called the duo B. Experimental Band (dBxB), led by Lisa Mezzacappa and Jason Levis. We’re simultaneously testing the limits of musical expression and the impacts of Internet latency on audio perception.

You have had an amazing career, including 32 years at Intel. How did that prepare you for your role as CEO of NovaSignal?
First is the insight into the value of data. I led the Data Center business at Intel from the early days of cloud computing through the explosive industry-wide investment in AI. Through the low cost and pervasive nature of cloud computing it became possible to utilize data to inform business operations and to create new business opportunities. Data became a source of value. In joining NovaSignal it was instantly clear that the cerebral blood flow data being collected through our robotic-AI ultrasound system was a source of tremendous untapped opportunity. Within the first three months we reshaped our corporate strategy and product roadmap to leverage our unique data sets. Through accumulation and analysis of cerebral data we provide insight into the diagnosis of stroke, use predictive analytics to guide the clinical team, and create algorithms that detect illnesses that present themselves in the brain.
The second, more fundamental capability I acquired over 32 years at Intel was leadership skills. When I joined Intel our CEO was Andy Grove. Andy is renowned for his management philosophy documented in the 1985 best seller “High Output Management”. Intel’s success was rooted in a structured approach: a focus on leveraging the full expertise of the organization, holding each other accountable to achieve our collective best, and succeeding through transparency and inclusion. Andy’s management style formed my own style – a result impossible to escape given the strong culture he created at Intel. Upon joining NovaSignal I found a collection of highly talented individuals. The intellectual capacity of the organization was superior. What was lacking was leadership and operational structure. On my first day as CEO, I told the founder and inventor, Robert Hamilton, “You have created the most challenging elements of a successful company: the invention and the marketing demand. What’s left is the easy stuff: operational excellence.” And in one year we have transformed the company into an entity I believe Andy would applaud.
We have not seen AI adopted as widely in healthcare as we have in other industries, such as financial services. What do you attribute that slower uptake to, and how can NovaSignal help to change that?
Each industry sector has adopted technology and AI at different rates. We have been talking about “the digitization of business” for over a decade and yet many industries are still in the early-adopter phase. The financial industry was the first to move to technology-based operations. Implementation occurred in the late nineties as the internet emerged as a capable communication system for enterprise. The speed of adoption by the finance industry was driven by the clear and compelling ROI. The move from manual transactions on the trading floor to high-frequency trading came with huge financial gains. The subsequent application of predictive analytics (AI) to financial trading brough further gains.
The healthcare industry has irrefutably been the last major industry to “digitize”. At the highest level, the reason is that change is hard. Change begins with a compelling reason, either tremendous opportunity (as was with the financial industry) or devastating loss. Over time it has been demonstrated that the integration of technology into medical workflows delivers unquestioned gains: from the disruption in healthcare through telemedicine, the dramatic increase in the consumerization of healthcare with devices and apps, and the early adoption of AI in countries like China compelled by a significant shortage of healthcare professionals. We have at last reached the tipping point of technology adoption in healthcare.
Once a compelling reason for change is made, the second step is a tangible and viable path to achieve success. At NovaSignal we have delivered the solution – through technology – to create the biggest breakthrough in neurological care in our lifetime. This may sound bold, but the void is immense as demonstrated by the number of people who suffer today. As one neurologist stated, “NovaSignal has brought cerebral ultrasound into the 21st century.”
These are eventful times to be in the AI and robotics business. What excites you the most about the potential for change in how we approach healthcare? Conversely, what keeps you up at night?
There has never been a more exciting time to be an entrepreneur in healthcare.
Countless healthcare industry surveys state the top spending priority for 2021 is AI and the use of data to drive improved outcomes. Electronics, data and AI are and will continue to change the way care is administered resulting in improved patient outcomes. At NovaSignal we are focused on enabling the diagnosis of stroke, the leading cause of life-time disability worldwide. We all know someone that has suffered a stroke and it is painful to watch the debilitating change in their lives, particularly difficult given the vast number of effective treatments of stroke. Through robotics, AI and cloud-based computing we have the ability to easily and rapidly identify the existence of stroke-causing events by providing a window into the brain. We are a company that intends to succeed financially, but we come to work each day to save lives.
Outside of the professional sphere, what can you share about yourself that your colleagues might be surprised to learn – any unique hobbies or stories?
My latest hobby (obsession) emerged through the fate of my friends. I noticed a disturbing trend: my busy executive girlfriends were falling. One friend fell down cement stairs on her way to give a conference keynote, breaking her tailbone. A friend fell off her bike and broke her collar bone. And another fell while simply walking down the sidewalk, catching her heel, and breaking her ankle. I realized we were getting old. It was clear I would be the next to go if I didn’t invest in gaining flexibility and core strength. For the past two years I have religiously attended yoga class two times a week. I am not yet a yogini – and I do fall every now and then – but I have managed to emerge unscathed.
